
A 2024 paper published on arXiv (2411.10005) analyzed how PostgreSQL performs on NVMeVirt, a software-defined NVMe storage platform, and found that the storage subsystem's I/O characteristics have a dramatic effect on database throughput — but only when PostgreSQL is configured to take advantage of them. The default PostgreSQL configuration ships deliberately conservative: designed to run safely on the oldest possible hardware, not to extract maximum performance from modern infrastructure. On a server with 64 GB of RAM and an NVMe drive capable of delivering a million IOPS, the default settings leave most of that hardware sitting idle. This guide covers the parameters that actually matter, what they do, and what values to use in production.
Most high-impact PostgreSQL tuning comes down to editing postgresql.conf and reloading — no schema changes, no application code modifications, and for most parameters, no service downtime. A simple SELECT pg_reload_conf(); applies the majority of changes at runtime. Only a handful of parameters — including shared_buffers and max_connections — require a full restart. That makes PostgreSQL tuning unusually low-risk compared to many other performance interventions.

Image: Intel P3608 NVMe flash SSD, PCI-E add-in card — Nosachevd (CC BY-SA 4.0), via Wikimedia Commons
Why PostgreSQL Ships With Conservative Defaults
PostgreSQL's defaults are calibrated for a hypothetical minimum-spec machine: roughly 512 MB of RAM, a single spinning hard disk, and maybe a dozen concurrent users. The two most consequential defaults are shared_buffers = 128MB and work_mem = 4MB. On a server with 64 GB of RAM, those settings allow PostgreSQL to use less than 0.2% of available memory for its shared buffer cache before going to disk. Every query that fetches a data page not in that cache triggers a disk read — and even on NVMe storage, a disk read is orders of magnitude slower than a memory access.
The defaults exist for good reason: they prevent PostgreSQL from crashing on constrained hardware. But any team running PostgreSQL in production on modern infrastructure is leaving significant performance on the table if they have not tuned these settings to match their actual resources.
Memory Parameters: shared_buffers, work_mem, and effective_cache_size
shared_buffers is the most impactful single parameter to tune. It controls the size of PostgreSQL's shared buffer cache — the pool of memory that all connections share for caching table and index data pages. The universal recommendation is to set this to 25–30% of total system RAM. On a 64 GB server, that means shared_buffers = 16GB. Beyond approximately 30%, returns diminish: the operating system's own page cache handles additional caching, and giving PostgreSQL more shared_buffers does not translate proportionally to better hit rates.
Changing shared_buffers requires a restart. To see whether your current setting is adequate, query pg_statio_user_tables and compare heap_blks_hit (served from shared_buffers) versus heap_blks_read (read from disk). A buffer hit ratio below 90% on a stable workload suggests the cache is undersized for the working data set.
work_mem controls how much memory each sort operation and hash table can use before spilling to temporary disk files. The critical word is "each" — a single complex query can spawn multiple sort operations, and those multiply across concurrent connections. Setting work_mem to 256 MB per connection sounds generous until you realize 50 connections each running a two-sort query consumes 25 GB instantly. A safe starting point for OLTP workloads is 16–64 MB. For analytics workloads with low concurrency and large aggregations, raise it per session: SET work_mem = '512MB'; before a heavy query, then let it revert afterward.
maintenance_work_mem governs memory for VACUUM, CREATE INDEX, and ALTER TABLE ADD FOREIGN KEY. These operations are infrequent but can be resource-intensive. Setting it to 512 MB to 2 GB allows indexes to build faster and autovacuum to process dead tuples more efficiently. It is safe to set this substantially higher than work_mem because maintenance operations do not run at the same concurrency level as user queries.
effective_cache_size is not a memory allocation — PostgreSQL does not reserve this amount. It is a hint to the query planner about how much memory is available across shared_buffers plus the OS page cache. Set it to approximately 75% of total RAM. The planner uses this value to decide whether an index scan or a sequential scan is cheaper. An inaccurate value here can cause the planner to make systematically poor choices — particularly undervaluing index scans on large tables.
Storage-Aware Parameters: random_page_cost and effective_io_concurrency
This is where modern hardware fundamentally changes the tuning calculus, and where the NVMe-focused research is most directly applicable. Research analyzing PostgreSQL performance on NVMe storage (arXiv:2411.10005) confirms that NVMe's latency and throughput characteristics differ dramatically from spinning disk — and that PostgreSQL's query planner needs configuration updates to reflect this reality.
random_page_cost represents the planner's estimate of the relative cost of a random disk page fetch versus a sequential one. The default is 4.0, calibrated for spinning hard drives where seeking to a random track is genuinely expensive. On NVMe storage, random access latency is a fraction of a millisecond — nearly indistinguishable from sequential access. Setting random_page_cost = 1.1 for NVMe (or 1.5–2.0 for SATA SSD) tells the planner to prefer index scans far more aggressively. On a default-configured PostgreSQL running on NVMe, the planner frequently chooses sequential scans when index scans would be significantly faster, simply because it assumes random I/O is expensive when it is not.
effective_io_concurrency tells PostgreSQL how many concurrent I/O operations your storage device can handle simultaneously. For spinning disks, the default of 1 is correct. For SATA SSD, set it to 200. For NVMe with deep hardware queue support, 200–1000 is appropriate, depending on the device's rated queue depth. This parameter influences bitmap heap scans and allows PostgreSQL to issue prefetch requests more aggressively — a straightforward win on storage that can actually service those requests in parallel.
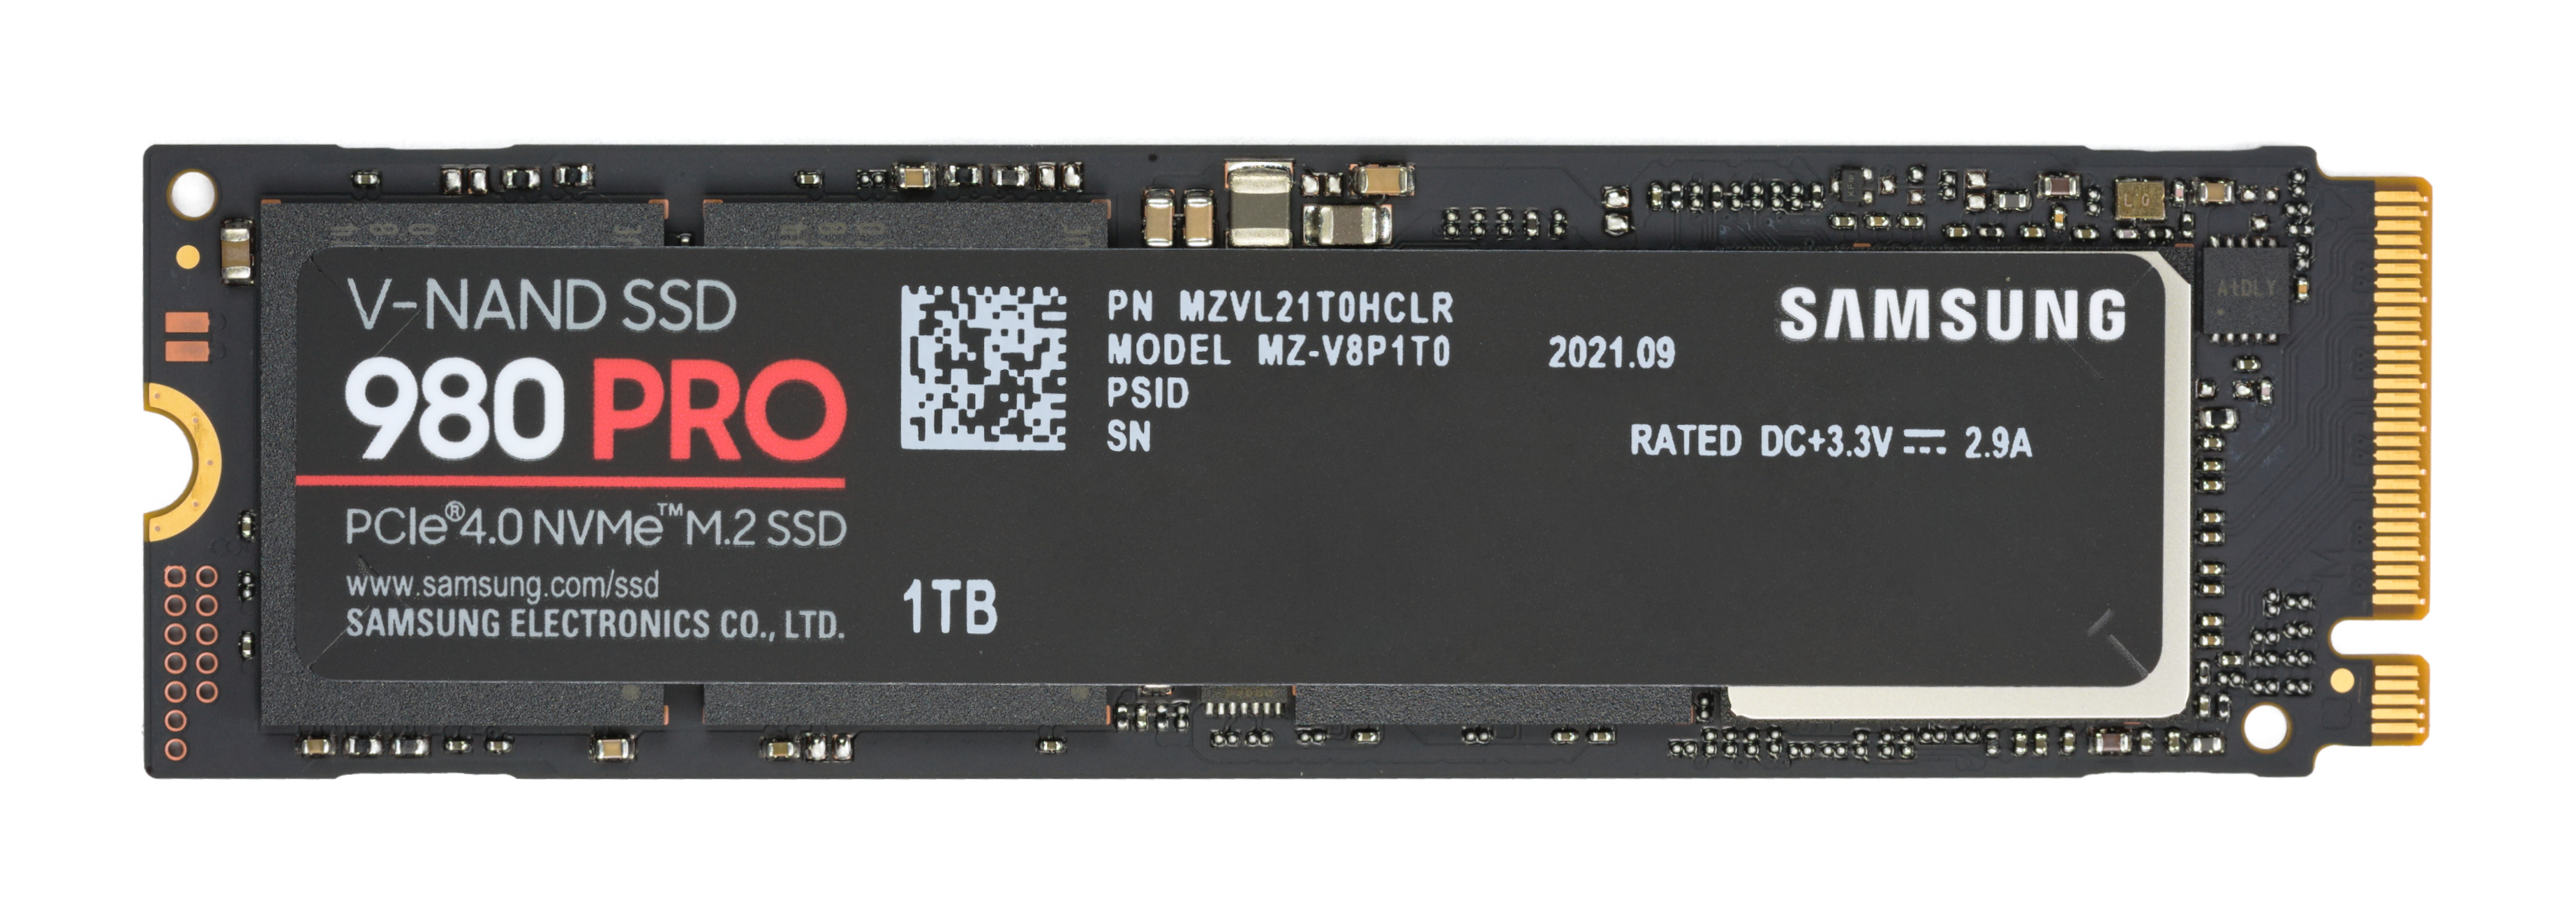
Image: Samsung 980 PRO PCIe 4.0 NVMe SSD 1TB-top — D-Kuru (CC BY-SA 4.0), via Wikimedia Commons
WAL and Checkpoint Configuration
PostgreSQL writes every change to its Write-Ahead Log (WAL) before modifying actual data files, ensuring crash safety. Poorly tuned WAL settings create a recognizable pattern: normal steady-state performance punctuated by periodic I/O spikes when a checkpoint flushes all dirty pages to disk at once.
wal_buffers should be set explicitly to 64MB. The default of -1 auto-selects 1/32 of shared_buffers, which is usually fine but can be suboptimal on high-write workloads. An explicit 64MB is a safe floor that avoids WAL buffer contention under write pressure.
checkpoint_completion_target controls how spread out checkpoint I/O is over the checkpoint interval. At the default of 0.9, PostgreSQL spreads dirty page writes across 90% of the interval rather than flushing everything at the checkpoint deadline. This significantly smooths I/O patterns. Keep this at 0.9 — reverting to earlier default values of 0.5 is a common mistake that reintroduces checkpoint spikes.
max_wal_size controls how large the WAL can grow before a forced checkpoint. The default of 1 GB is often too small for write-heavy workloads, triggering forced checkpoints more frequently than the checkpoint_timeout-based schedule. For most production systems handling significant write volume, 4–16 GB is more appropriate. Larger values mean checkpoints are less frequent and more predictable, reducing I/O variability.
Connection Management and Autovacuum
max_connections defaults to 100. Each PostgreSQL connection spawns a backend process consuming roughly 5–10 MB of RAM, plus per-connection overhead in shared memory structures. Running 300 or 500 direct connections does not improve throughput — it degrades it, because the OS scheduler is constantly context-switching between hundreds of processes. The correct architecture is to keep max_connections at 100–200 and place PgBouncer in transaction-mode pooling in front of PostgreSQL. PgBouncer holds thousands of application connections but multiplexes them onto a small pool of real PostgreSQL connections, delivering both high concurrency for applications and low process-count for the database.
autovacuum is frequently blamed for performance problems and incorrectly disabled. Dead tuples left by UPDATE and DELETE operations bloat tables, degrade index performance, and — if ignored long enough — cause table wraparound, a critical failure mode. Autovacuum is what prevents all of this. The correct response to autovacuum performance issues is to tune it, not disable it. For large tables, set autovacuum_vacuum_scale_factor = 0.01 to trigger vacuum when just 1% of rows are dead (rather than the default 20%), preventing buildup before it becomes a problem. Increase autovacuum_max_workers from 3 to 5–8 on systems with many tables, and adjust autovacuum_vacuum_cost_delay downward if I/O headroom allows autovacuum to run faster without impacting foreground queries.
| Parameter | Default | Recommended (NVMe, 64 GB RAM) | Restart Required? |
|---|---|---|---|
| shared_buffers | 128MB | 16GB (25% of RAM) | Yes |
| work_mem | 4MB | 32–64MB (OLTP) | No (reload) |
| effective_cache_size | 4GB | 48GB (75% of RAM) | No (reload) |
| random_page_cost | 4.0 | 1.1 (NVMe) | No (reload) |
| effective_io_concurrency | 1 | 200–1000 (NVMe) | No (reload) |
| max_wal_size | 1GB | 4–16GB | No (reload) |
| max_connections | 100 | 100–200 + PgBouncer | Yes |
Frequently Asked Questions
Should I use a tool like pgTune instead of setting parameters manually?
Tools like pgTune are a useful starting point — they calculate recommended values based on your hardware profile and workload type. We recommend using them to generate an initial configuration, then validating against your actual workload using pg_stat_statements and EXPLAIN (ANALYZE, BUFFERS). No automated tool accounts for your specific access patterns, index design, or concurrency levels, so treat generated configurations as a baseline to refine through measurement, not a final answer to install and forget.
How do I measure whether shared_buffers is actually working?
Query pg_statio_user_tables and compare the ratio of heap_blks_hit to total accesses (heap_blks_hit + heap_blks_read). A buffer hit ratio above 99% on a stable OLTP workload indicates the working set fits in cache. Below 90% is a signal that shared_buffers is undersized relative to your data access patterns. Also monitor pg_stat_bgwriter — high buffers_clean counts suggest the buffer pool is under pressure and pages are being evicted before they are reused.
Is it safe to set random_page_cost below 1.0?
Technically possible, but rarely warranted and potentially counterproductive. Setting random_page_cost equal to or below seq_page_cost tells the planner that random and sequential page fetches are equally cheap — which is only true for data that fits entirely in memory. On NVMe, 1.1 reflects empirical reality well: random access is nearly as fast as sequential, but not perfectly equal. Values below 1.0 can cause the planner to over-prefer index scans even in cases where a sequential scan would be faster — for example, when a query must return more than 10–15% of a large table's rows.
Bottom Line: PostgreSQL performance tuning is about aligning the database's internal assumptions with the hardware it actually runs on. The most impactful changes on modern infrastructure are raising shared_buffers to 25% of RAM, setting random_page_cost = 1.1 for NVMe storage, and increasing effective_io_concurrency to match your device's queue depth. Apply changes incrementally, measure before and after each with pg_stat_statements and query-level EXPLAIN ANALYZE, and benchmark your actual workload rather than relying on generic tables alone. Configuration tuning is among the highest-return investments a team can make in PostgreSQL performance — and unlike schema changes or application rewrites, most of it takes effect with a single reload.
Sources & References:
Analyzing Performance Characteristics of PostgreSQL and MariaDB on NVMeVirt — arXiv:2411.10005 (November 2024)
Disclaimer: This article is for informational purposes only. Technology landscapes change rapidly; verify information with official sources before making technical decisions.