
When a monolithic application fails, the stack trace tells you almost everything you need. When a distributed system fails, a single user request may traverse a dozen independently-deployed services before returning an error — and no single service's logs will tell the full story. This fundamental shift in failure mode is why observability has become one of the most important engineering practices of the past decade. Unlike traditional monitoring, which answers the question "is the system up?" observability answers "why is this specific request failing, and which service is responsible?"
Getting observability right in microservices is not a matter of adding more logging. It requires a structured approach across three complementary signal types — and increasingly, a unified framework to tie them together.
The Three Pillars: Logs, Metrics, and Traces
The industry has converged on three fundamental observability signals, each revealing a different dimension of system behavior:
| Signal Type | What It Captures | Primary Use Case | Common Tools |
|---|---|---|---|
| Logs | Discrete events with context | Post-incident forensics | Loki, ELK Stack, Fluentd |
| Metrics | Aggregated numeric measurements over time | Alerting, capacity planning | Prometheus, InfluxDB, Grafana |
| Traces | End-to-end request journey across services | Latency attribution, dependency mapping | Jaeger, Zipkin, Tempo |
Each pillar is necessary, but none is sufficient on its own. Metrics tell you that p99 latency spiked at 2:14 AM. Logs help you find the error messages around that time. But only traces show you that the spike was caused by a cascade from a slow database query in your inventory service, propagated through your cart service, and surfacing as a timeout in your API gateway — none of which is visible in a single service's logs or metrics alone.
Distributed Tracing: How Request Context Flows Across Services
Distributed tracing works by attaching a unique trace ID to every incoming request at the entry point of your system. Each service that handles the request creates a span — a record of its unit of work — and passes the trace ID downstream to any services it calls. The result is a tree of spans that reconstructs the full lifecycle of the request across all service boundaries.
The mechanism for propagating this context between services is standardized by the W3C Trace Context specification, which defines the traceparent and tracestate HTTP headers. A conforming request header looks like:
traceparent: 00-0af7651916cd43dd8448eb211c80319c-b7ad6b7169203331-01The four fields encode: the version, a 128-bit trace ID, the parent span ID, and flags (including the sampling decision). When every service in your stack honours this header, any tracing backend can reconstruct the full request graph from the individual spans each service emits — even when those services are written in different languages and deployed by different teams.

Image: Opsview 6 EA dashboard — Jjainschigg (CC BY-SA 4.0), via Wikimedia Commons
OpenTelemetry: The Unified Observability Standard
Until recently, each observability tool — Jaeger, Zipkin, Datadog, New Relic — required its own SDK and agent. Instrumenting a single service for multiple backends meant duplicating instrumentation code. OpenTelemetry (OTel), a Cloud Native Computing Foundation (CNCF) project, solves this by providing a vendor-neutral API, SDK, and protocol (OTLP) that any backend can receive.
The typical OpenTelemetry deployment has three components:
- SDK in each service: Auto-instrumentation packages for major frameworks (Express, Django, Spring Boot, etc.) handle trace context propagation and metric collection with zero manual code in most cases.
- OTel Collector (sidecar or daemonset): Receives signals via OTLP, JAEGER, or Zipkin format; applies processors (tail-sampling, attribute filtering, resource detection); exports to one or more backends.
- Backend(s): Prometheus + Grafana for metrics, Tempo or Jaeger for traces, Loki or Elasticsearch for logs — or a managed SaaS like Grafana Cloud, Honeycomb, or Lightstep.
Structured Logging: Making Logs Machine-Readable and Trace-Correlated
Logs become dramatically more useful when they are structured (JSON or key-value pairs) rather than free-form text, and when they include the current trace ID and span ID. A structured log entry with trace correlation looks like:
{"level":"error","message":"payment gateway timeout","service":"checkout-api","trace_id":"0af7651916cd43dd8448eb211c80319c","span_id":"b7ad6b7169203331","latency_ms":3014,"user_id":"u_8821"}With the trace ID embedded in the log, your logging tool (Loki, Elasticsearch) can jump directly to the corresponding trace in Jaeger or Tempo. This is the key integration between the three pillars: traces act as the backbone that correlates logs and metrics from across different services into a coherent picture of what happened during a specific request.
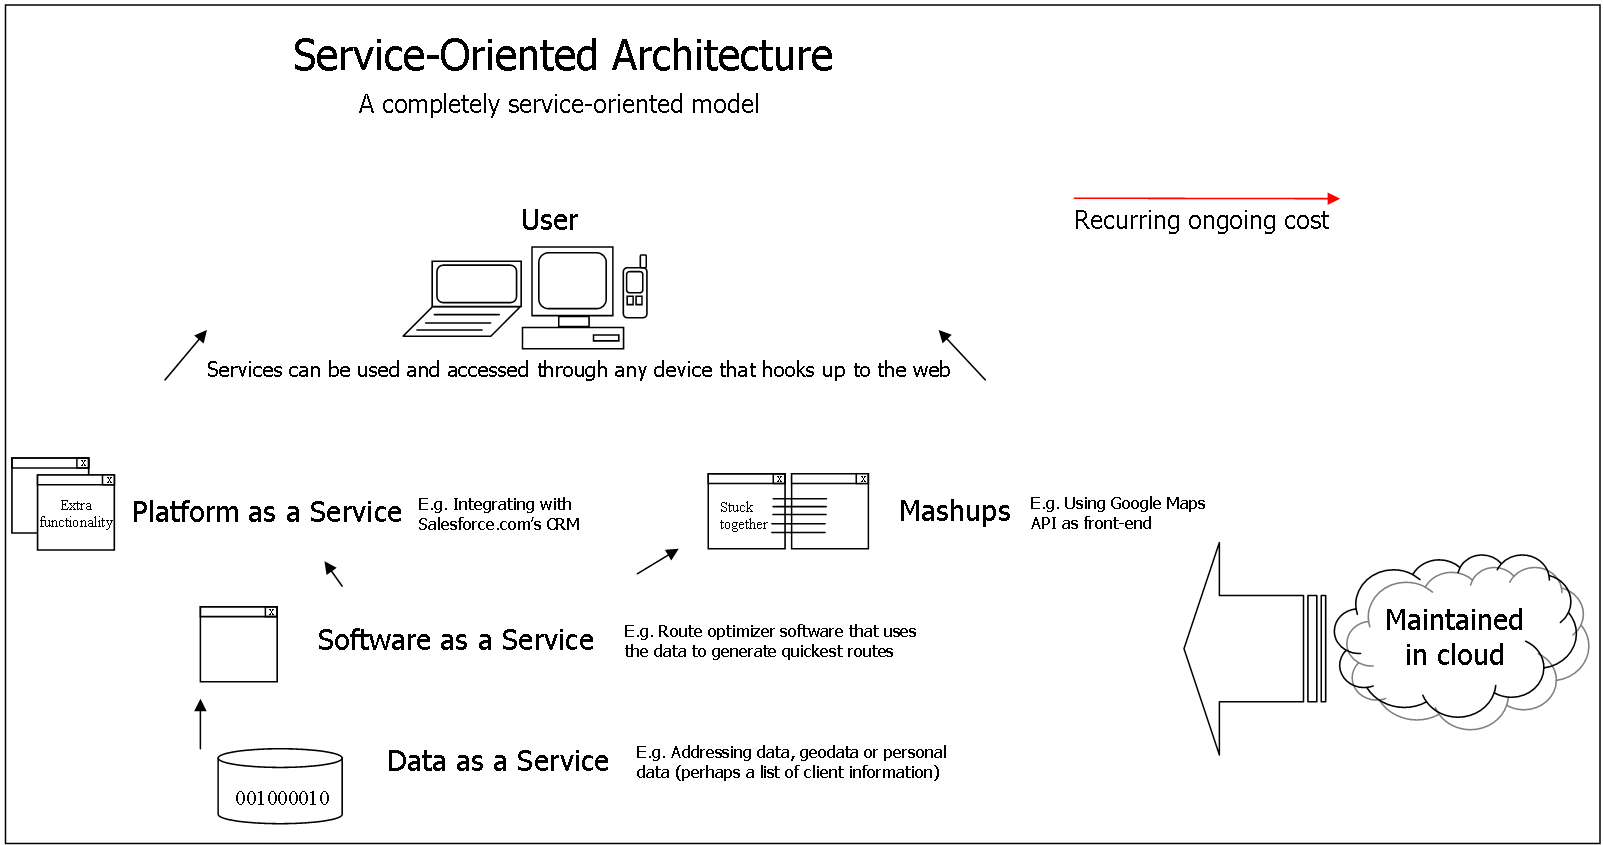
Image: SOA Detailed Diagram — Wikimedia contributor (CC BY 3.0), via Wikimedia Commons
Sampling Strategies: Not Every Trace Needs to Be Stored
At high request volumes, storing every trace is prohibitively expensive. Two principal sampling strategies manage this:
- Head-based sampling: The sampling decision is made at the trace entry point, before any downstream work happens. Simple to implement; the OTel SDK supports configurable percentage-based head sampling. The trade-off is that you may drop the exact slow or erroneous trace you needed.
- Tail-based sampling: The decision is deferred until the complete trace is assembled by the OTel Collector, allowing you to always keep traces that contain errors, exceeded latency thresholds, or specific user IDs — while dropping successful, fast traces. The OTel Collector's tail-sampling processor implements this. It requires buffering traces in memory until all spans arrive, but the quality of retained traces is far higher.
A practical starting point: head-sample at 10–20% for baseline coverage, and add a tail-sampling rule that retains 100% of traces containing errors or p99-exceeding latency. This keeps storage costs manageable while ensuring you never lose the traces that actually matter.
Key Metrics Every Microservice Should Expose
The four "golden signals" defined by Google's SRE practices provide a minimum viable metric set for any service:
- Latency: Time to serve requests (distinguish successful vs. error latency separately)
- Traffic: Request rate (requests per second)
- Errors: Error rate and error count by status code
- Saturation: How full the service is — CPU, memory, connection pool utilization
Expose these as Prometheus-format metrics from every service, and you have the foundation for meaningful SLO (Service Level Objective) alerting — alerts that fire when user-facing outcomes degrade, not when internal health checks flicker.
Frequently Asked Questions
What is the difference between monitoring and observability?
Monitoring is the practice of collecting and alerting on predefined signals you know to care about in advance — CPU usage crossing 80%, error rate exceeding 1%. Observability is the property of a system that allows you to understand its internal state from its external outputs, including unexpected failure modes you did not anticipate when writing the alerts. A well-monitored system tells you when something is wrong. An observable system lets you figure out why, even for failure modes you have never seen before. In practice, observability requires all three pillars (logs, metrics, traces), while monitoring often relies only on metrics.
Do I need distributed tracing if I have good logging?
For a small number of services (two or three), structured logging with request IDs can be sufficient. As the service count grows, manually correlating logs across services becomes impractical — and causal relationships between services (service A called service B which called service C, which was slow) become invisible. Distributed tracing makes these cross-service dependencies and latency contributions explicit, without requiring any additional log statements. The two are complementary: tracing gives you the map of the request's path; logs give you the detail at each stop.
How should I start if my services have no observability today?
Start with OpenTelemetry auto-instrumentation for your highest-traffic service only. Auto-instrumentation for Express, Django, Spring Boot, and most major frameworks instruments HTTP client calls, database queries, and inbound requests without writing instrumentation code. Add the OTel Collector with a Prometheus exporter and a Jaeger or Tempo backend. Once you have traces and metrics for one service, add the adjacent services it calls. This incremental approach delivers immediate value (you can now see cross-service latency for that service) while avoiding the "instrument everything at once" migration risk.
Bottom Line
Observability in microservices is not a feature you add at the end — it is an architectural practice that shapes how services are built from the beginning. The three pillars (logs, metrics, traces) address different failure investigation needs, and OpenTelemetry has made it practical to instrument all three with a single vendor-neutral SDK that exports to any backend. We recommend starting with tail-sampled distributed tracing for your critical user-facing services, correlating logs with trace IDs, and building SLO-based alerts from the four golden signals. With this foundation in place, on-call engineers can move from "something is broken" to "here is exactly which service introduced the latency, at what time, for which users" — in minutes rather than hours.
Sources & References:
W3C Trace Context Specification — W3C Recommendation (2021)
OpenTelemetry Documentation — Cloud Native Computing Foundation (CNCF)
Google SRE Book: Monitoring Distributed Systems — Google (2016)
Disclaimer: This article is for informational purposes only. Technology landscapes change rapidly; verify information with official sources before making technical decisions.