
A paper published on arXiv in April 2026 analyzed monitoring approaches for large language model systems across multiple layers — from confidence calibration at the model level to infrastructure tracing at the platform level — and found that most production deployments are covering only a fraction of what is actually needed for meaningful observability. A companion paper from October 2025 surveyed current monitoring practices for machine learning systems more broadly and identified similar structural gaps. Both findings converge on a problem that teams running distributed systems of any kind will recognize: monitoring and observability are not the same thing, and the difference matters enormously when something goes wrong.
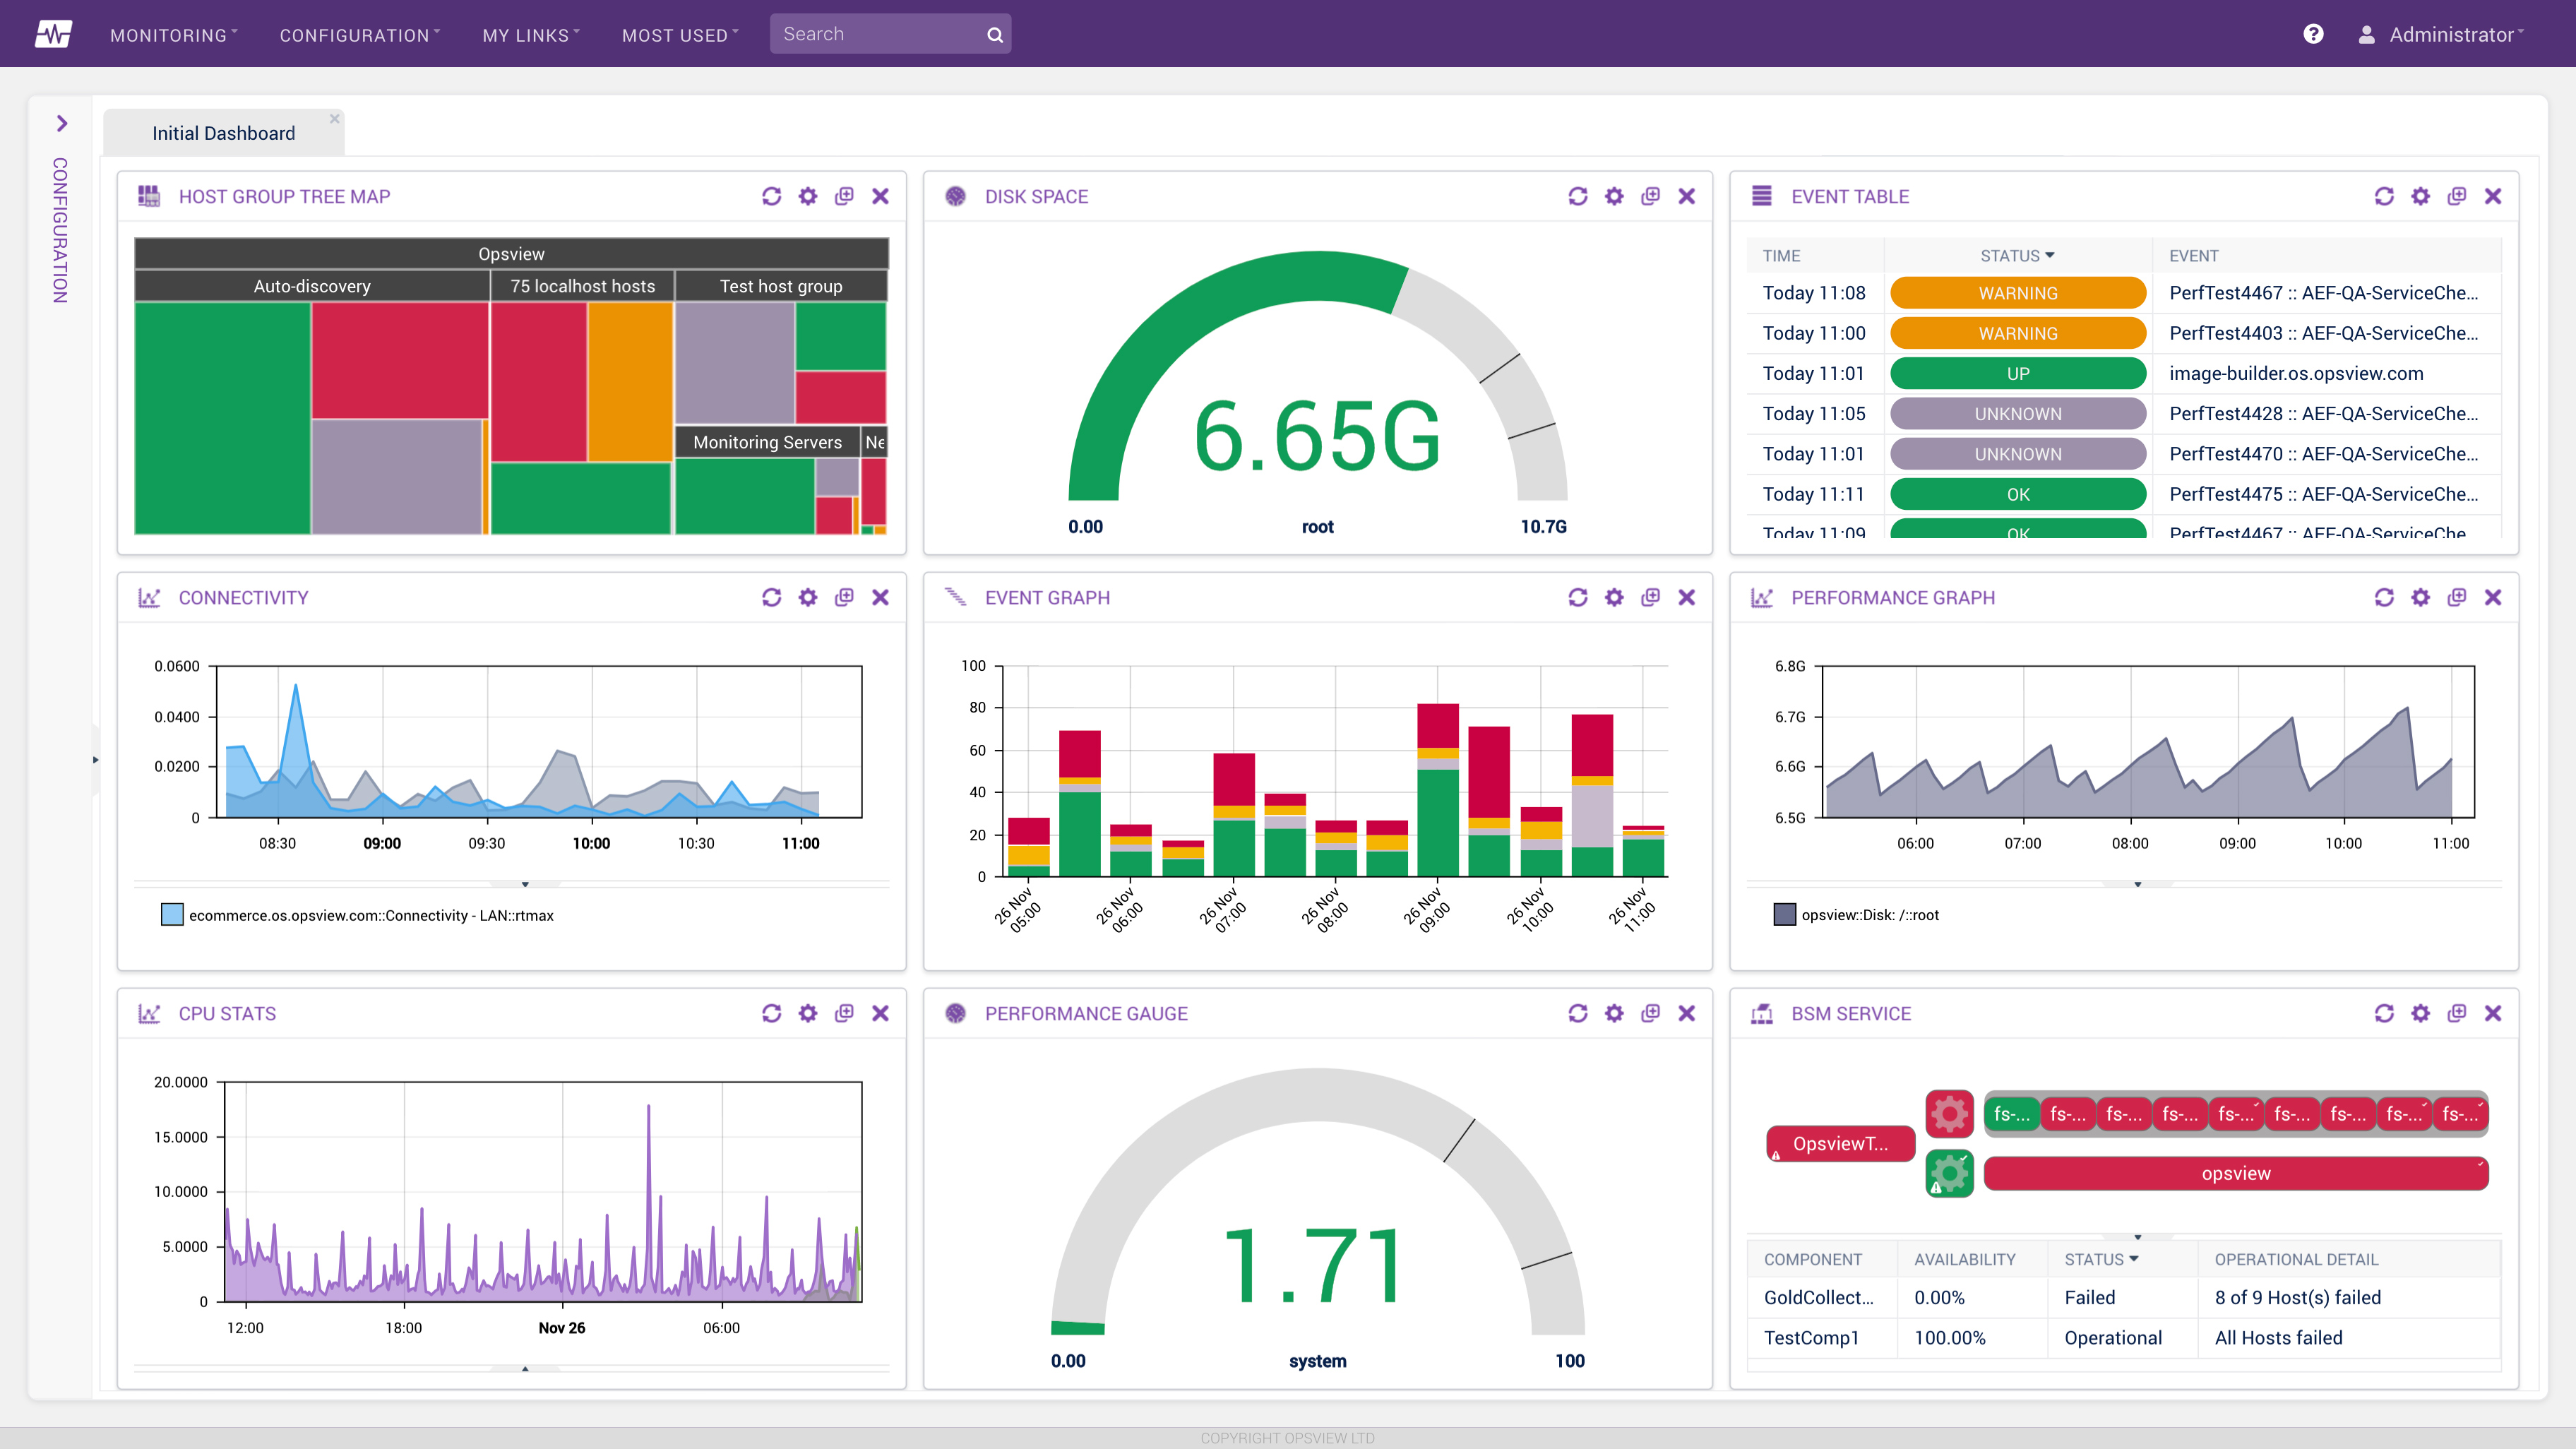
Image: Opsview Monitor 6.0 Dashboard.jpg — Opsview, Ltd (CC BY-SA 3.0), via Wikimedia Commons
Observability vs. Monitoring: More Than Semantics
The distinction between monitoring and observability is one of the most misunderstood in the SRE and platform engineering space. Monitoring is the practice of watching a predefined set of metrics and alerting when they cross known thresholds. It answers the question: "Is the thing I was already worried about happening?" Observability, by contrast, is the property of a system that allows engineers to understand its internal state by examining its external outputs — logs, metrics, and traces — without having anticipated the specific failure mode in advance.
A well-monitored system tells you that CPU is at 95 percent or that error rates crossed 1 percent. An observable system lets you ask arbitrary questions about why a subset of requests from a specific user cohort using a specific feature path started experiencing elevated latency after a deployment three weeks ago — and actually get answers from the data you already collected.
In practice, most teams have monitoring. Far fewer have genuine observability. The gap is not just philosophical — it directly determines mean time to recovery (MTTR) when complex failures occur in distributed architectures.
What the Research Shows About Current Practice Gaps
The October 2025 paper "Monitoring and Observability of Machine Learning Systems: Current Practices and Gaps" (arXiv:2510.24142) surveyed production ML systems and found that most monitoring implementations focus heavily on infrastructure-level metrics — CPU, memory, request latency — while largely neglecting model-level behavioral signals. Teams were tracking whether the serving infrastructure was up, but not whether the model was producing degraded or anomalous outputs.
This matters because ML systems fail in ways that infrastructure metrics simply do not capture. A model can be serving requests at normal latency with no infrastructure errors while simultaneously producing outputs that have drifted significantly from the distribution it was validated on. Input drift, concept drift, output degradation, and calibration failures are invisible to infrastructure-only monitoring dashboards.
The April 2026 paper on LLM observability (arXiv:2604.26152) drilled deeper into this problem specifically for large language models, identifying a multi-layer observability requirement: confidence calibration monitoring at the model output layer, semantic coherence tracking, prompt-response consistency checks, and full distributed tracing from user request to final token generation across all intermediate service hops. The authors found that even teams running relatively mature ML infrastructure pipelines were typically covering only two or three of the required layers.
The Three Pillars — and Why Each One Is Necessary
The observability literature converges on three fundamental signal types, each of which answers a different class of question about system behavior:
Logs are timestamped, structured records of discrete events. They are the most human-readable signal and are invaluable for reconstructing the exact sequence of operations that led to a failure. The challenge with logs in distributed systems is volume and correlation: a single user request may touch dozens of services, each emitting its own log stream. Without a shared trace identifier propagated across all service boundaries, logs from different services cannot be reliably joined to reconstruct the full request path.
Metrics are time-series numerical measurements — request rates, error rates, latency percentiles, saturation levels. Metrics are extremely efficient to store and query and are the foundation of alerting. The weakness of metrics is cardinality: you can measure p99 latency for a service overall, but once you want to slice that by user segment, feature flag state, model version, and region simultaneously, you rapidly hit the cardinality ceiling of most time-series databases.
Traces are the most structurally complex but arguably the most powerful pillar for distributed systems. A trace records the causally linked chain of operations that comprise a single user request as it flows through multiple services. Each operation within a trace is a span, and spans carry timing data, metadata, and parent-child relationships that allow engineers to pinpoint exactly where in the request path latency was introduced or errors occurred. OpenTelemetry has emerged as the de facto open standard for emitting and collecting traces, metrics, and logs in a vendor-neutral format.
| Signal Type | Best For | Key Limitation |
|---|---|---|
| Logs | Event reconstruction, debugging discrete failures | High volume; correlation across services requires trace IDs |
| Metrics | Alerting, trend detection, SLO tracking | Cardinality explosion when slicing by multiple dimensions |
| Traces | Latency attribution, cross-service debugging, dependency mapping | Instrumentation cost; sampling trade-offs affect completeness |
| Model behavior signals (ML-specific) | Drift detection, calibration monitoring, output quality | Requires domain-specific tooling; often absent in practice |
Observability for AI and ML Systems: The Emerging Gaps
The 2025 and 2026 research papers both highlight that ML and AI systems introduce observability challenges that the standard three-pillar model does not fully address. Infrastructure observability can tell you the serving pod is healthy, but it cannot tell you that the embedding model being called upstream has started producing vector representations that diverge from its validation distribution — a form of silent failure that can persist undetected for extended periods.
The 2026 LLM observability paper proposes extending the observability stack with additional layers specific to generative AI systems: monitoring output confidence scores and calibration over time, tracking semantic similarity between outputs and expected response patterns, detecting prompt injection or adversarial input patterns, and recording full prompt-completion pairs (with appropriate privacy controls) for human evaluation sampling.
For teams already running OpenTelemetry instrumentation on their serving infrastructure, adding model-level signals is tractable but requires deliberate instrumentation work. The signals do not emerge automatically from infrastructure-level tooling.
What Teams Most Commonly Get Wrong
Based on the patterns documented in both research papers and well-established industry practice, several failure modes appear consistently:
- Alert-only monitoring without investigation tooling. Teams invest heavily in defining alerting thresholds but do not invest equivalently in the tooling needed to actually debug what the alert is pointing at. Alerts without investigability just move the problem downstream.
- Insufficient trace sampling for tail latency. Many teams use head-based sampling strategies that probabilistically drop traces before their outcome is known. This systematically under-samples the slow, failing requests that are most important to debug. Tail-based sampling — where the sampling decision is made after the trace is complete — captures errors and latency outliers much more reliably.
- No SLOs tied to observability data. Service Level Objectives create a clear, contractual definition of what "working" means. Without SLOs, teams lack a principled framework for deciding when a degraded state warrants incident response versus watchful waiting. SLOs should be derived from user-facing outcomes, not from internal implementation metrics.
- Treating logs as the only signal. In many organizations, logs are the primary or only debugging tool. For distributed systems spanning multiple services, log-only debugging is slow and error-prone. Distributed traces collapse the debugging time for cross-service latency and dependency failures dramatically.
Frequently Asked Questions
Do I need all three pillars for a small service?
For a simple, single-service application with modest traffic, structured logs and a small set of key metrics are usually sufficient. The value of distributed tracing becomes apparent when requests span multiple services or when latency attribution across service boundaries is non-obvious. As a rule of thumb, add tracing when you find yourself trying to correlate logs from more than two services to debug a single user-facing issue.
Is OpenTelemetry worth the instrumentation overhead?
For most teams, yes. OpenTelemetry's auto-instrumentation libraries for common frameworks (HTTP clients, database drivers, message queues) can capture the majority of useful trace data with minimal manual work. The payoff is vendor portability — you can switch between observability backends without re-instrumenting your services. The main overhead is operational: someone needs to own the OpenTelemetry Collector configuration and understand sampling strategy.
How do you monitor ML models without logging sensitive user data?
The practical approach is to log behavioral signals rather than raw inputs and outputs. Confidence score distributions, output length distributions, latency by model version, and anomaly flags derived from semantic similarity checks can all be logged without retaining user content. For compliance-sensitive environments, differential privacy techniques can be applied to aggregate behavioral metrics before storage. The 2026 LLM observability paper discusses several of these privacy-preserving monitoring patterns.
Bottom Line
The research is clear: most distributed systems teams, including those running mature ML pipelines, have significant gaps in their observability coverage. Infrastructure monitoring is table stakes, but it does not substitute for the ability to ask arbitrary questions about system behavior when an unexpected failure occurs. We recommend treating observability as a product capability rather than an operational checkbox — invest in OpenTelemetry instrumentation early, define SLOs tied to user-facing outcomes, adopt tail-based sampling for traces, and if you are running AI or ML systems, extend your observability stack with model-level behavioral signals that infrastructure monitoring cannot capture on its own.
Sources & References:
• "Monitoring and Observability of Machine Learning Systems: Current Practices and Gaps." arXiv:2510.24142, October 2025. arxiv.org/abs/2510.24142
• "AI Observability for Large Language Model Systems: A Multi-Layer Analysis of Monitoring Approaches from Confidence Calibration to Infrastructure Tracing." arXiv:2604.26152, April 2026. arxiv.org/abs/2604.26152
Disclaimer: This article is for informational purposes only. Technology landscapes change rapidly; verify information with official sources before making technical decisions.